


The month of September 2018 was a career highlight for me as we brought the inaugural Love to Ride challenge to Brisbane, my birth town. I had no doubt that a city as progressive as Brisbane (no bias here!) would embrace the challenge and do me proud. Of course, I was right! (When am I not?)
A roaring success, this workplace based cycling challenge saw 2,327 participants take part from over 220 organisations. One of the key features of the Love to Ride platform is the ability for our partners to access crucial data which helps them understand the drivers and barriers of people living in their city, ultimately culminating in better planning and communications.
Let’s jump in and take a look at some of the key results for Brisbane:
| Headline Results | Brisbane 2018 |
| Organisations | 221 |
| Participants | 2,327 |
|
244 |
|
487 |
|
1,569 |
| Distances (KM) | 603,854 |
| Total trips | 31,818 |
| % trips for transport purposes | 49% |
| CO2 saved (kg) | 34,459 |
Great to see over 49% of people logging using their bikes for commuting!
We often hear about the MAMIL* but the data consistently shows us that increasingly women love to be on their bikes too. Over 40% of registrants in Brisbane were female.
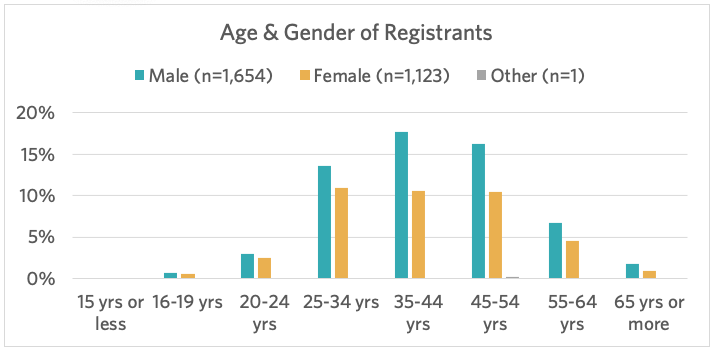
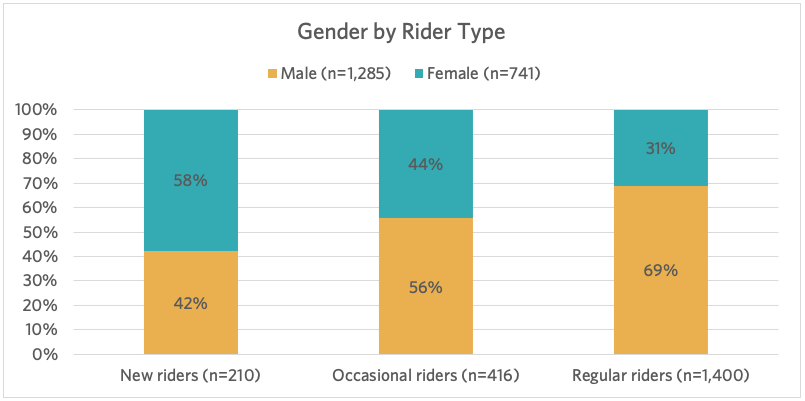
A closer look as to how that breaks down into rider level…
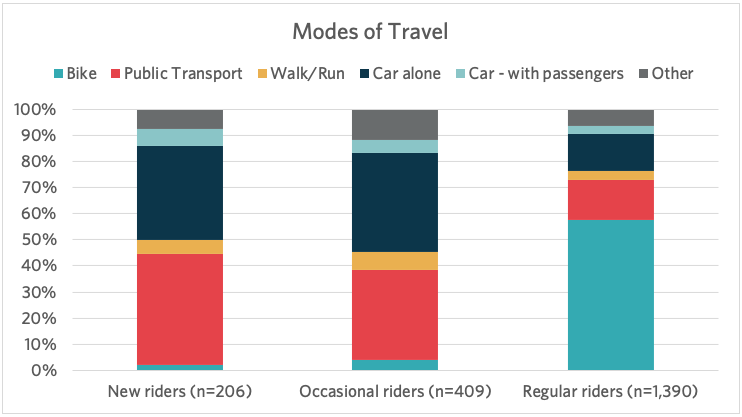
Public transport was the most frequent method of travel amongst new riders (43%) followed closely by driving alone (36%). The opposite was true for occasional riders, with driving alone at 38% and public transport close behind at 34%.
After we run a challenge, we look at how people’s attitudes and behaviours have shifted when compared to the baseline survey they completed at sign up.
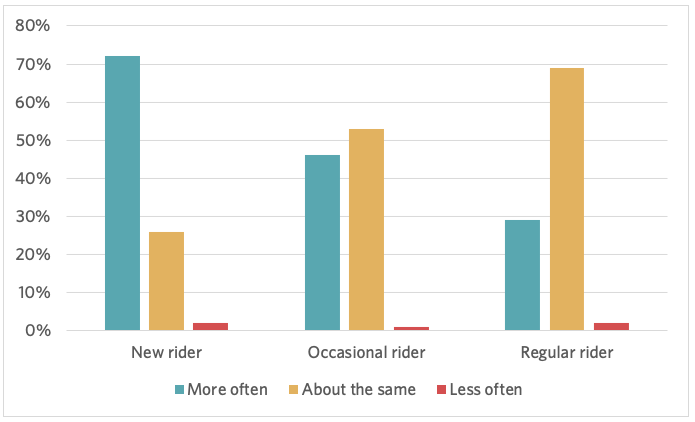
72% of new riders and 46% of occasional riders reported an intention to increase how often they ride compared to 12 months before the challenge. These ‘interested by concerned’ people had experienced a definite shift in behaviour.
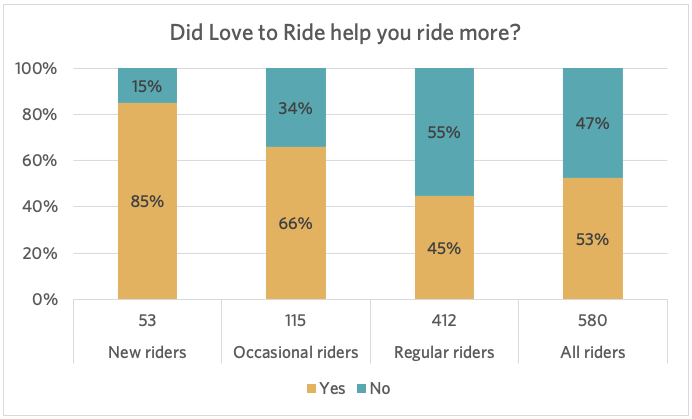
85% of new riders and 66% of occasional riders noted that the Love to Ride Brisbane challenge encouraged them to ride more often.
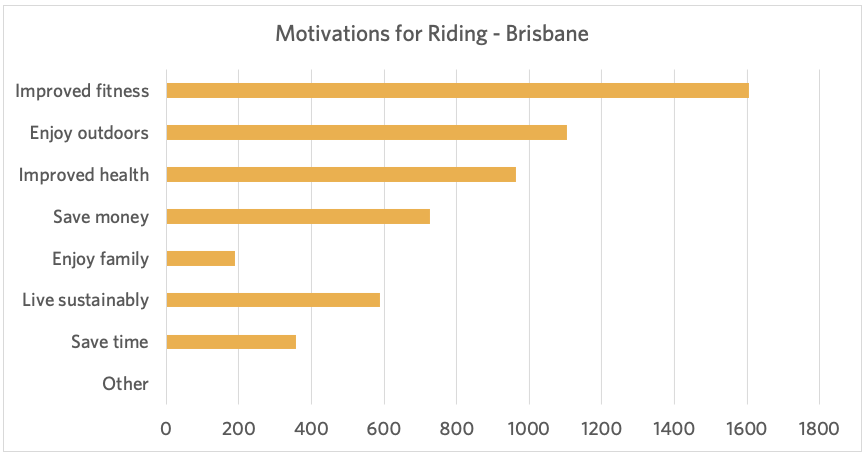
Not just the Jacarandas! Those Brisbanites sure are a healthy bunch!
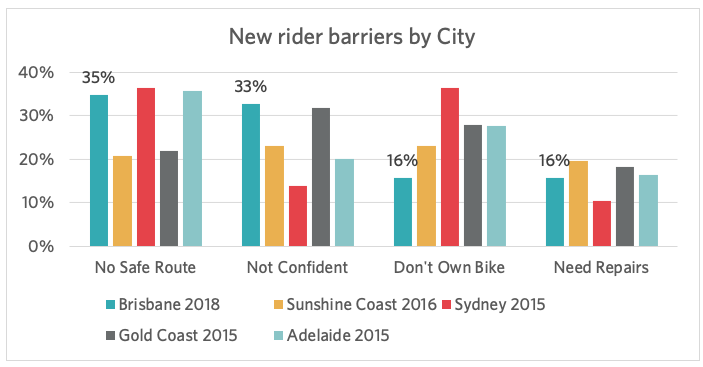
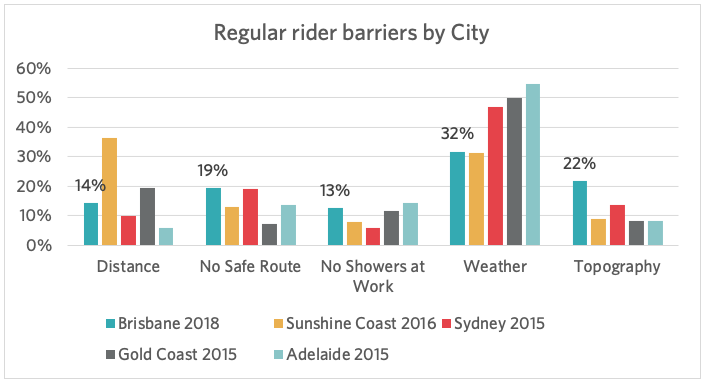
Giving new riders the confidence and knowledge they need to get out on a bike is crucial and universal to Aussie cities.
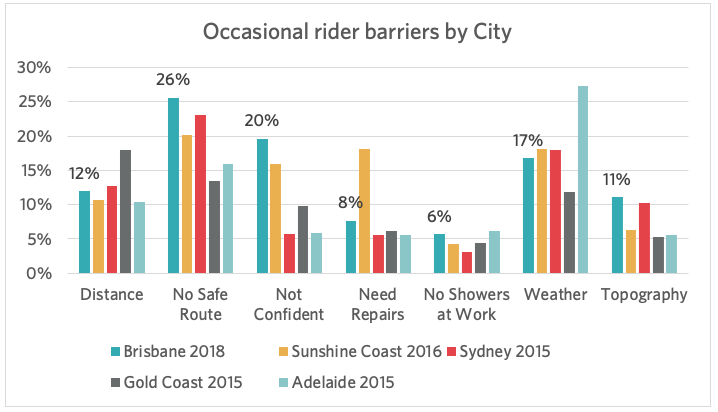
Certainly the type of rider influences the perceived barriers, however, weather is consistently the biggest factor for regular riders.
In fact, regardless of rider type, weather is a huge factor right across the globe too. Just check it out!
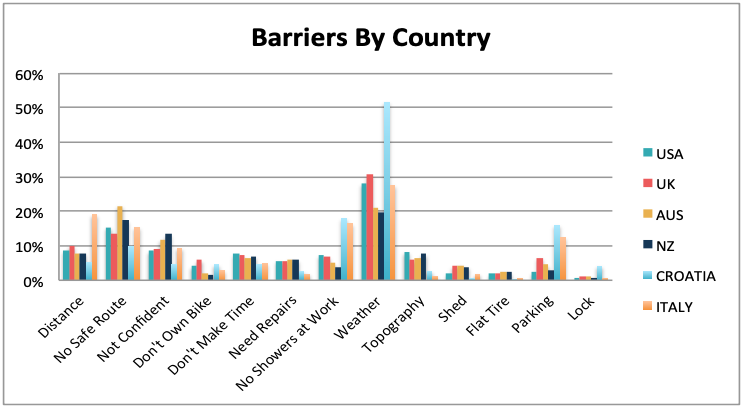
Amazing huh?
Our partners can access all this information and communicate with both existing and new riders in their area. Targeting in this way ensures the message is specific and relevant. So, all the good stuff our partners are doing to get more people riding... bike courses, infrastructure building, route planning services… is being received by the right audience segment making it more useful and effective to recipients.
Want to take the temperature of your city and get more people on bikes? Send me a message and let’s chat.
- Christina Sorbello
Love to Ride, Australia Country Manager
Love to Ride works in 13 countries around the world to get more people cycling, more often. If you’re interested in finding out how you can encourage cycling and collect useful data on cycling in your area, then please get in touch. We’re always happy to hear from people like yourself. Contact: hello@lovetoride.net

