


Waaaay back in the beginning, in the early noughties, the New Zealand Transport Authority (NZTA) was one of the very first partners to get behind the Workplace Cycle Challenge concept that gave birth to a social business now known as Love to Ride.
After 15 years of development, and expansion to 12 countries, Love to Ride returned to New Zealand again in 2017 and partnered with the NZTA to launch the 'Aotearoa Bike Challenge'.
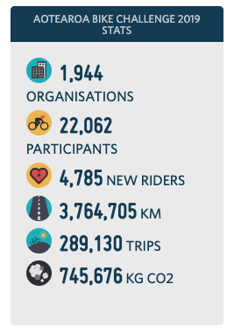
Having since been delivered three consecutive years, this country-wide event, has now successfully grown into the most popular and successful program of its kind in the world. In 2019 this culminated in a whopping 0.5% of the entire NZ population participating.
This blog explores some of the key features and findings of our most successful cycling encouragement and behaviour change program yet.
The flexibility within the Love to Ride platform allows for regions within a country to localise a site for their area and provide a local flavour to their participants. New Zealand regions did a particularly great job of this and this type of collaboration is reflected in the below levels of participation.
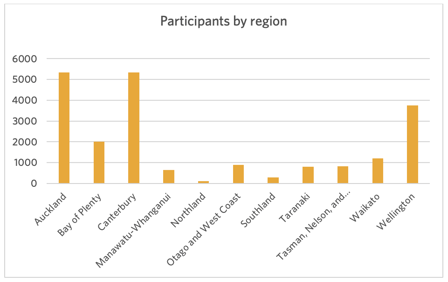
2% of the working age population of the Greater Christchurch Region (population 396,000) participated in this year's Love to Ride Aotearoa program.
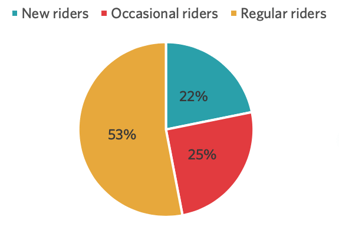
Our programs give existing riders the tools and resources they need to encourage the ‘interested but concerned’ would be riders of our communities to give cycling a go. Across all of our programs globally we see an approximate 1:1 ratio – that is for every regular rider who participates, they encourage a new or occasional rider to participate too.
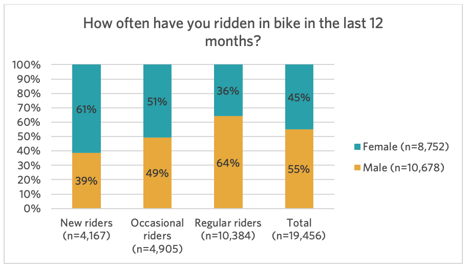
It may come as a surprise to some, in what is largely considered as a male-dominated recreation, but the below gender split graph is typical of what we are seeing in our Love to Ride programs around the world. As a team, we've worked hard to buck the gender imbalance trends and it's refreshing and exciting to see this work paying off in so many more women riding.
It’s also interesting to see that it’s fairly consistent across the regions:
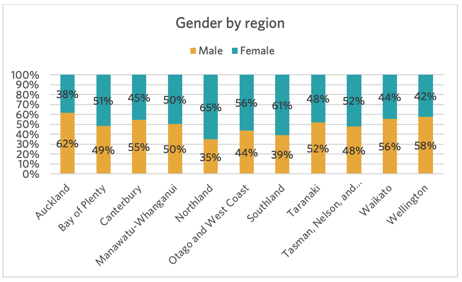
It's also interesting to note that the major urban centres like Auckland and Wellington, have higher proportions of male riders taking part (~60% male), while the more provincial areas like Northland and Southland have the opposite (~40% male and ~60% female).
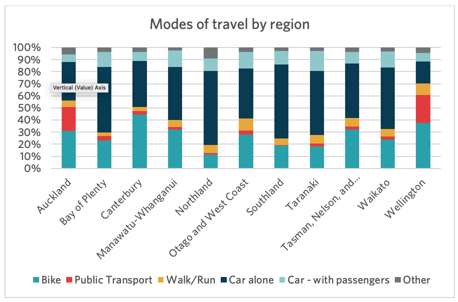
It may come as no surprise at all that driving alone was the most frequent method of commuting to work at 37%. This was closely followed by travelling by bike at 33%.
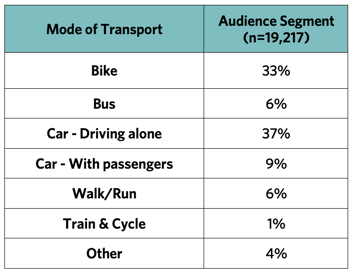
By splitting the data into regions, we can
also see the greatest opportunity for potential behaviour change with 50% or
more participants commuting to work by driving alone in Northland, Southland
and Bay of Plenty:
New Zealanders are well known for their commitment to sustainable living and this was reflected in the data when we asked them to tell us what motivated them to ride.
Living sustainably was the 3rd most important motivator at 33%, followed by 56% for enjoying the outdoors and 88% for improved fitness.
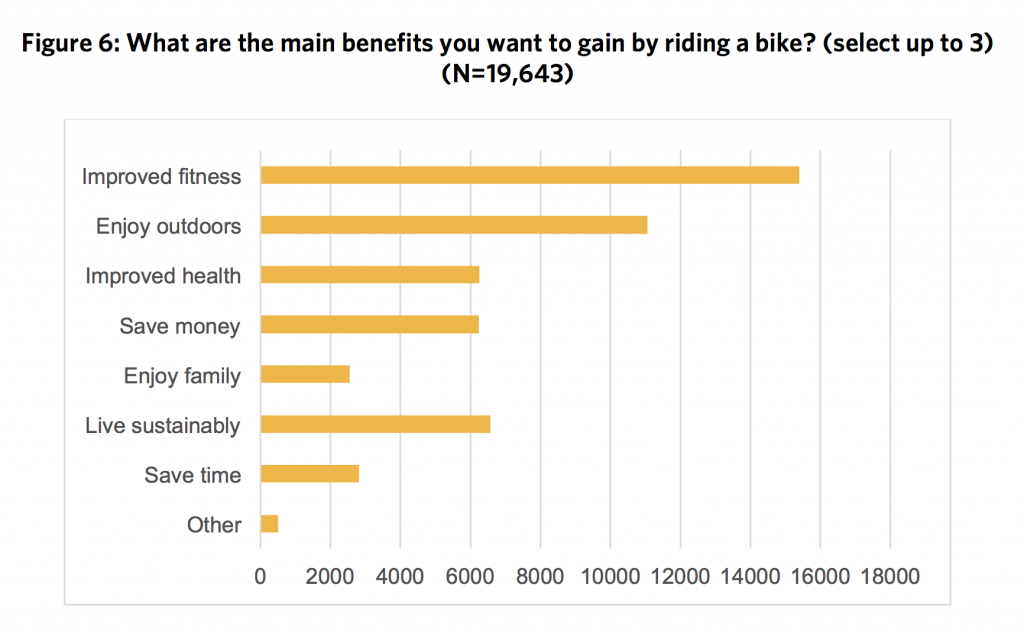
In fact, sustainability was more frequently cited over improved health for most of the regions except Tasman, Nelson & Marlborough and Waikato.
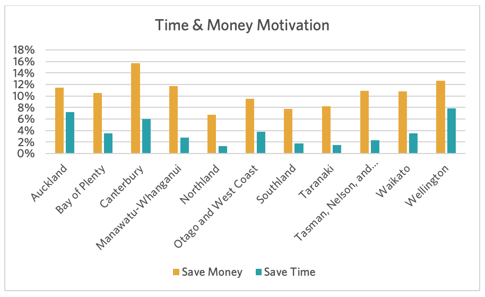
We can also compare the data by region to provide some insight into our communities. Saving money was more commonly cited in Canterbury as a key motivation (16% of respondents) compared to Northland (7%).
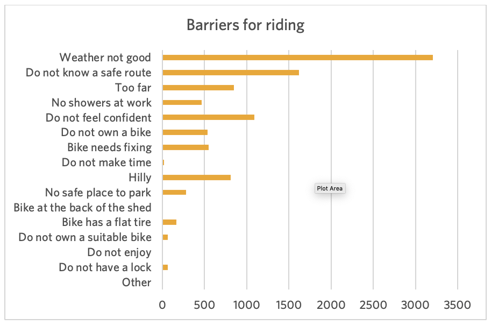
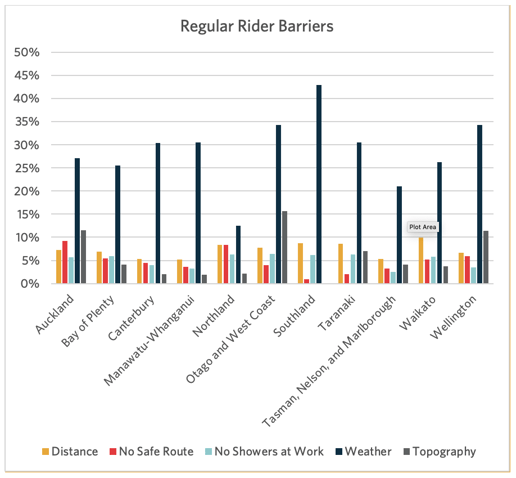
Globally, we consistently see weather as a barrier people tell us they face when riding a bike. By understanding what barriers people face, we are able to give them the tools to overcome them and move them along a personal journey of change.
Whether it's cycle confidence training for those who feel uneasy on the roads, discounts of great wet weather gear for riding in the rain, or a short video on how to fix a flat if the bike is in disrepair, Love to Ride works to break barriers down and, in doing so, open up the many benefits that riding brings.
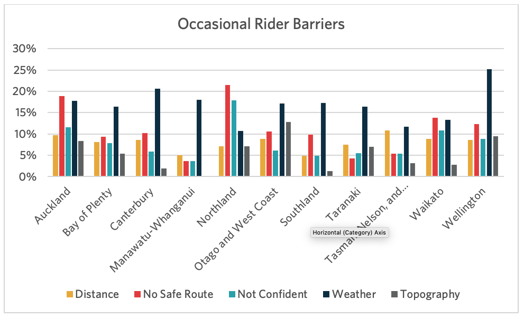
However, when we deep dive into rider type, we unveil more about what each group perceives as their main barriers. This information provides real insight into the kinds of interventions we can help facilitate to overcome these hurdles and ultimately change behaviour for the better.
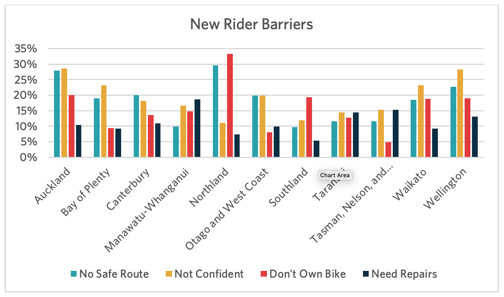
For most of the regions, 'not feeling confident' was the main barrier for new riders. This was closely followed or surpassed by 'not knowing a safe route'.
Auckland and Northland occasional riders cited not knowing a safe route as their main barrier to riding more often – all other regions attributed the weather as their main barrier. This was particularly notable in Wellington where 25% of respondents cited the weather as a barrier to riding or ridng more often.
Bad weather is more prominently a key barrier for regular riders largely due to it being one of a few barriers that are outside of our control. It is also the case that many of the other barriers have been whittled down to almost being non-existent, something that comes with time and experience.
The team at Love to Ride feel an incredible sense of pride having created a program that engaged so many people and through them achieved these results. For me, as a social marketer interested in social impact, it’s exactly these kinds of outcomes that get me excited for the potential for positive change in our cities and our communities globally.
In 2020, we hope to turn the needle even more and take the challenge to new heights. Mind-blowing!
Can we help you get more people in your community or business riding bikes? Email hello@lovetoride.net or take a peek at partners.lovetoride.net

