


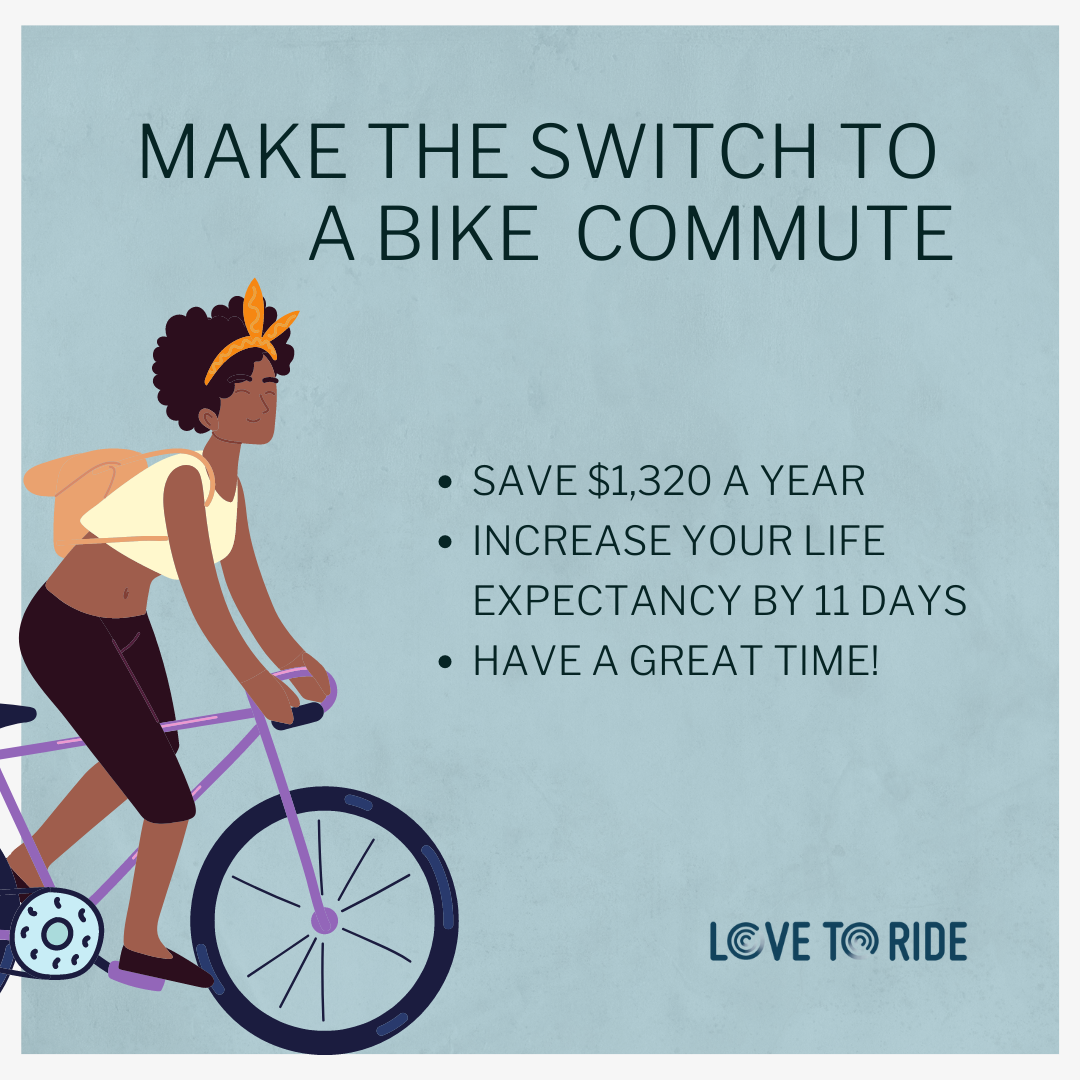
The cost of living is increasing globally. With international supplies of oil and gas selling at record prices, transportation and private vehicle usage cost increases are being felt by everyone. You can guarantee that people living in your region or city are already looking for ways to reduce their costly journeys and replace them with cheaper alternatives.
It sounds like bad news, but it’s also a huge opportunity for us all to encourage mode shift to the bicycle. When registering with Love to Ride, we ask riders what their motivators are and their barriers to traveling by bicycle. ‘Save money’ and ‘live sustainably’ are motivators that are being cited more and more by new registrants to Love to Ride - it’s time to leverage these motivators and demonstrate the tangible savings that people can make.
What sort of savings can riders expect to see if they swap cars for handlebars?
If a rider swaps a 5-mile commute for bicycling (when driving a medium sedan) the numbers can really start to stack up. We created some fun graphics you can use year-round to communicate this to people in your region. But if you want to really get under the numbers - keep scrolling to meet the OmniCalculator…
|
|
|
|

|
|
Calculate the benefits - in detail!
The OmniCalulator Bike vs Car is another great tool to demonstrate the value of riding a bike to complete a particular trip in terms of life expectancy gains, and reduction in carbon emissions. We ran a few common scenarios through and the results are really compelling.
Scenario 1 - 5 miles to work, 5 times a week
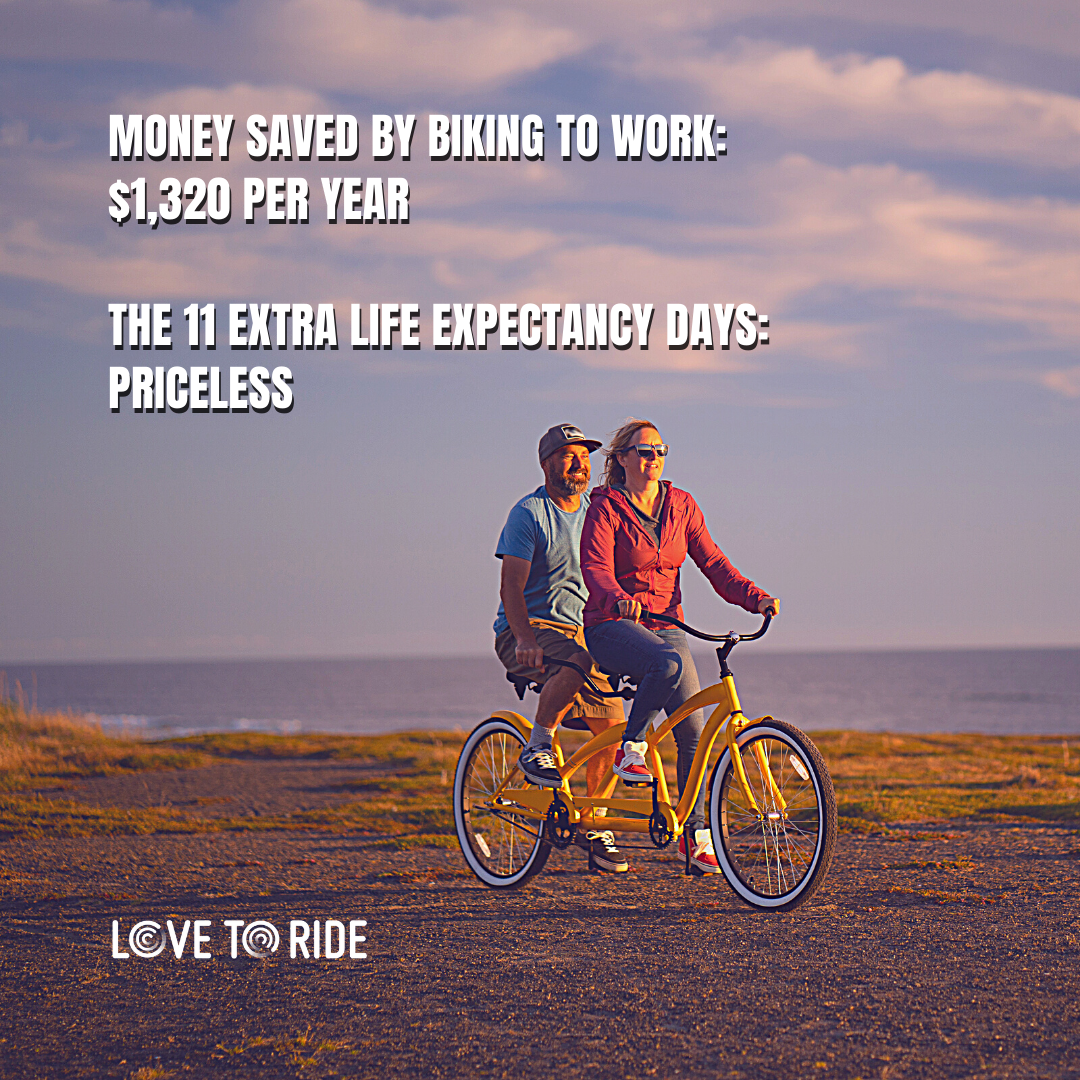
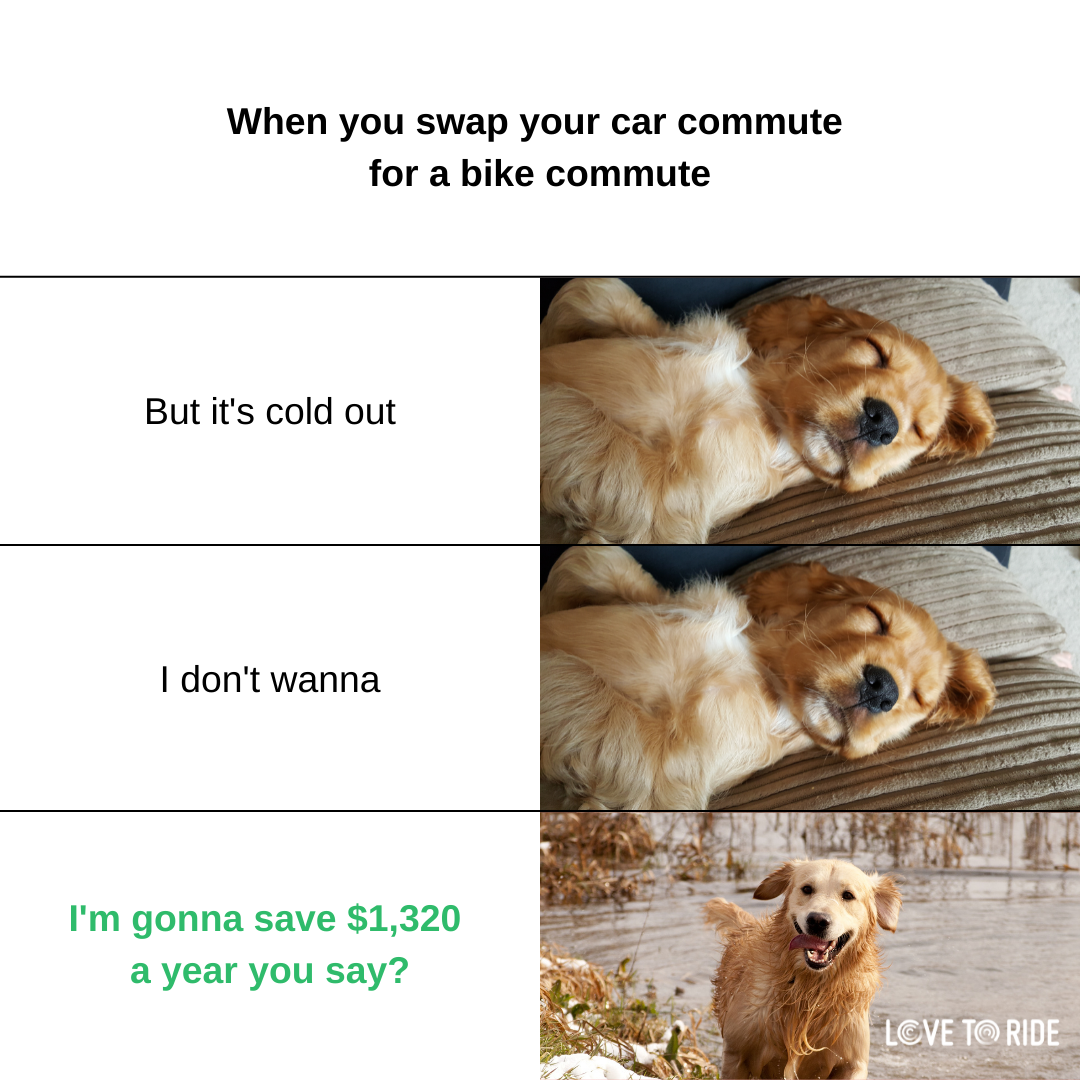
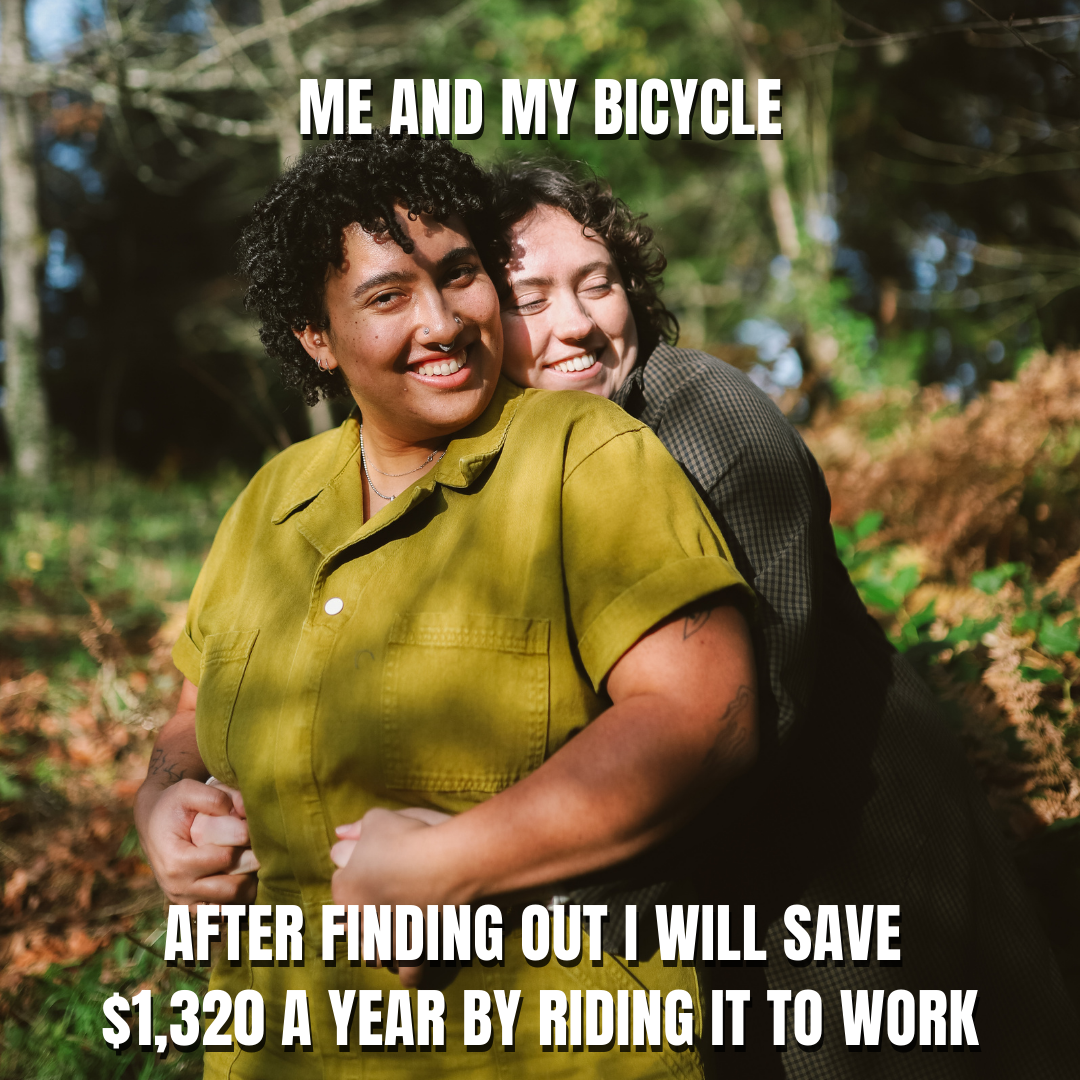
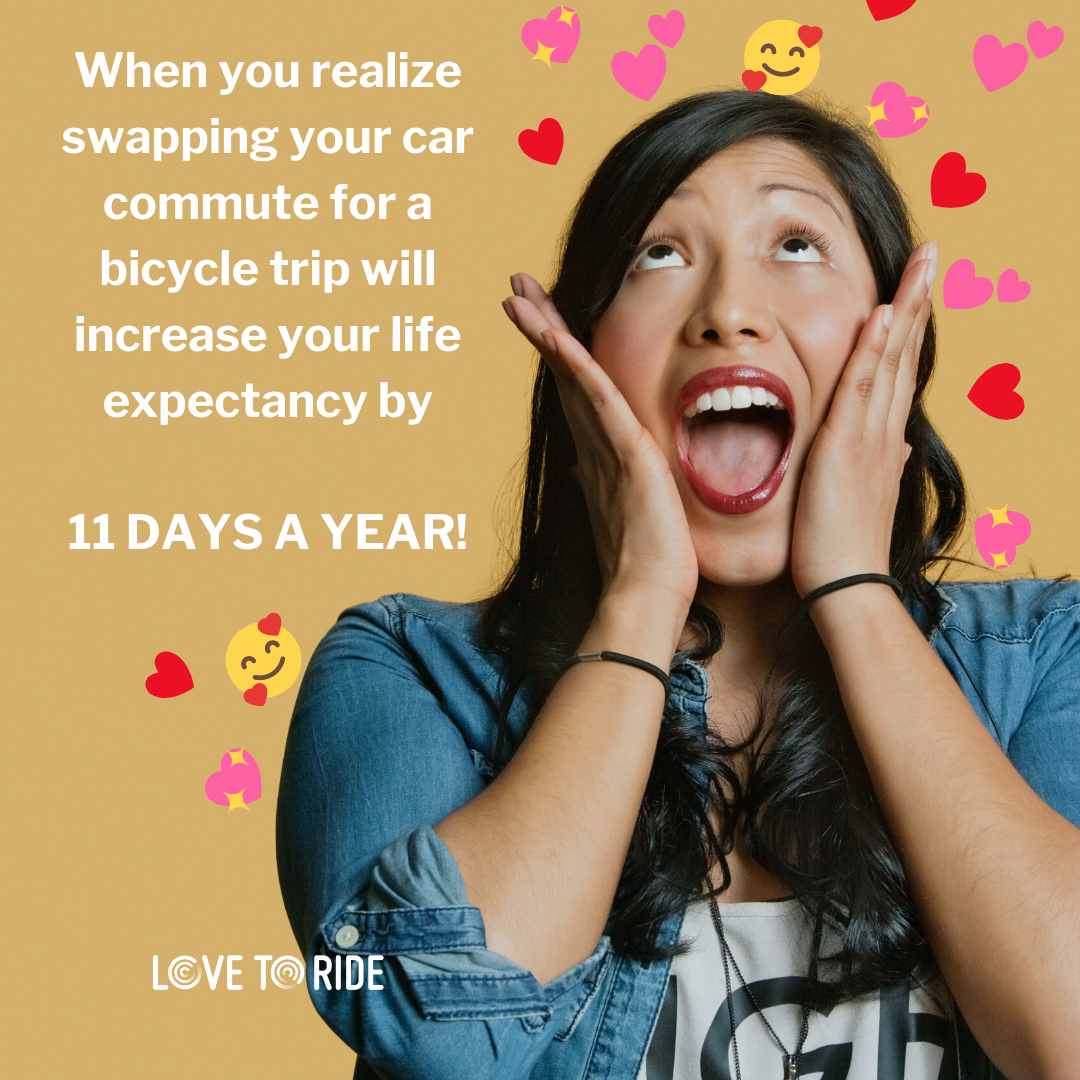
In just 1 year of riding a bike to work 5 times a week, rather than driving, the rider will have an extra 11.7 days of life expectancy and saved $1,320 / £1,015 / €1,223.43.

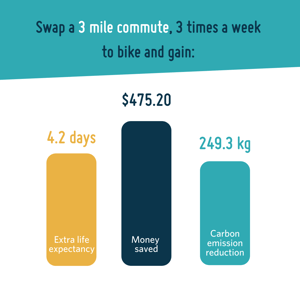
Scenario 2 - 3 miles to work, 3 times a week
In just 1 year of riding a bike to work 3 times a week, rather than driving, the rider will have an extra 4.2 days of life expectancy (more than they spend in the office each week) and save $475.20 / £365.35 / €440.43.
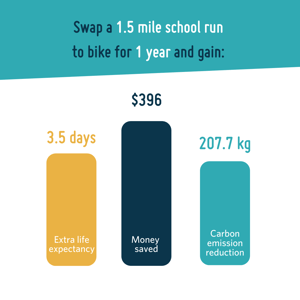
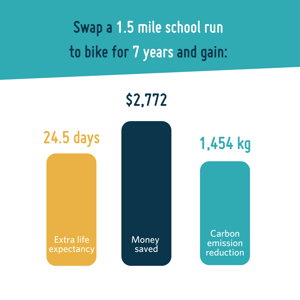
Scenario 3 - 1.5miles to school, 5 times a week
Just 1 year of conducting the school run by bike gives some sizeable savings financially and physically. If a parent makes this change long term (7 years is the time that children stay in primary education in the UK) they can improve their life expectancy by nearly a month and save over $2,772 / £2,131.18 / €2,569.73 in fuel costs for that one journey.
 |
 |
Want to see the potential life expectancy gains, carbon emission reductions, and money saved for people living in your region? You can use this table to get the financial savings and use this calculator to get the life expectancy and carbon emission savings. Next share the results - we have this handy Canva template if you want to create your own graphic like the charts above :-)
Interested in how we can help you to encourage and support more people to switch from cars to handlebars? Drop us an email: hello@lovetoride.net

